Manufacturing sector data insights 2025

Introduction to our data
The ShopCare dashboard makes work-related health and safety injury data more accessible using interactive dashboards and insights. Read more about our data sets in this Data & Insights Explanatory Notes document here.
The data draws on credible sources, including ACC, and is presented in a way that is relevant to manufacturing businesses in Aotearoa New Zealand. It highlights where harm is occurring, where progress is being made, and where there are clear opportunities to improve outcomes for workers.
The purpose of sharing these insights is practical. By understanding what the data is showing, manufacturing businesses can make informed decisions to strengthen safety systems, reduce injury rates, and support the health, safety and wellbeing of their kaimahi/workers.
The 2025 headlines
21,556
37,418
$163.3M
$4,364
29.0%
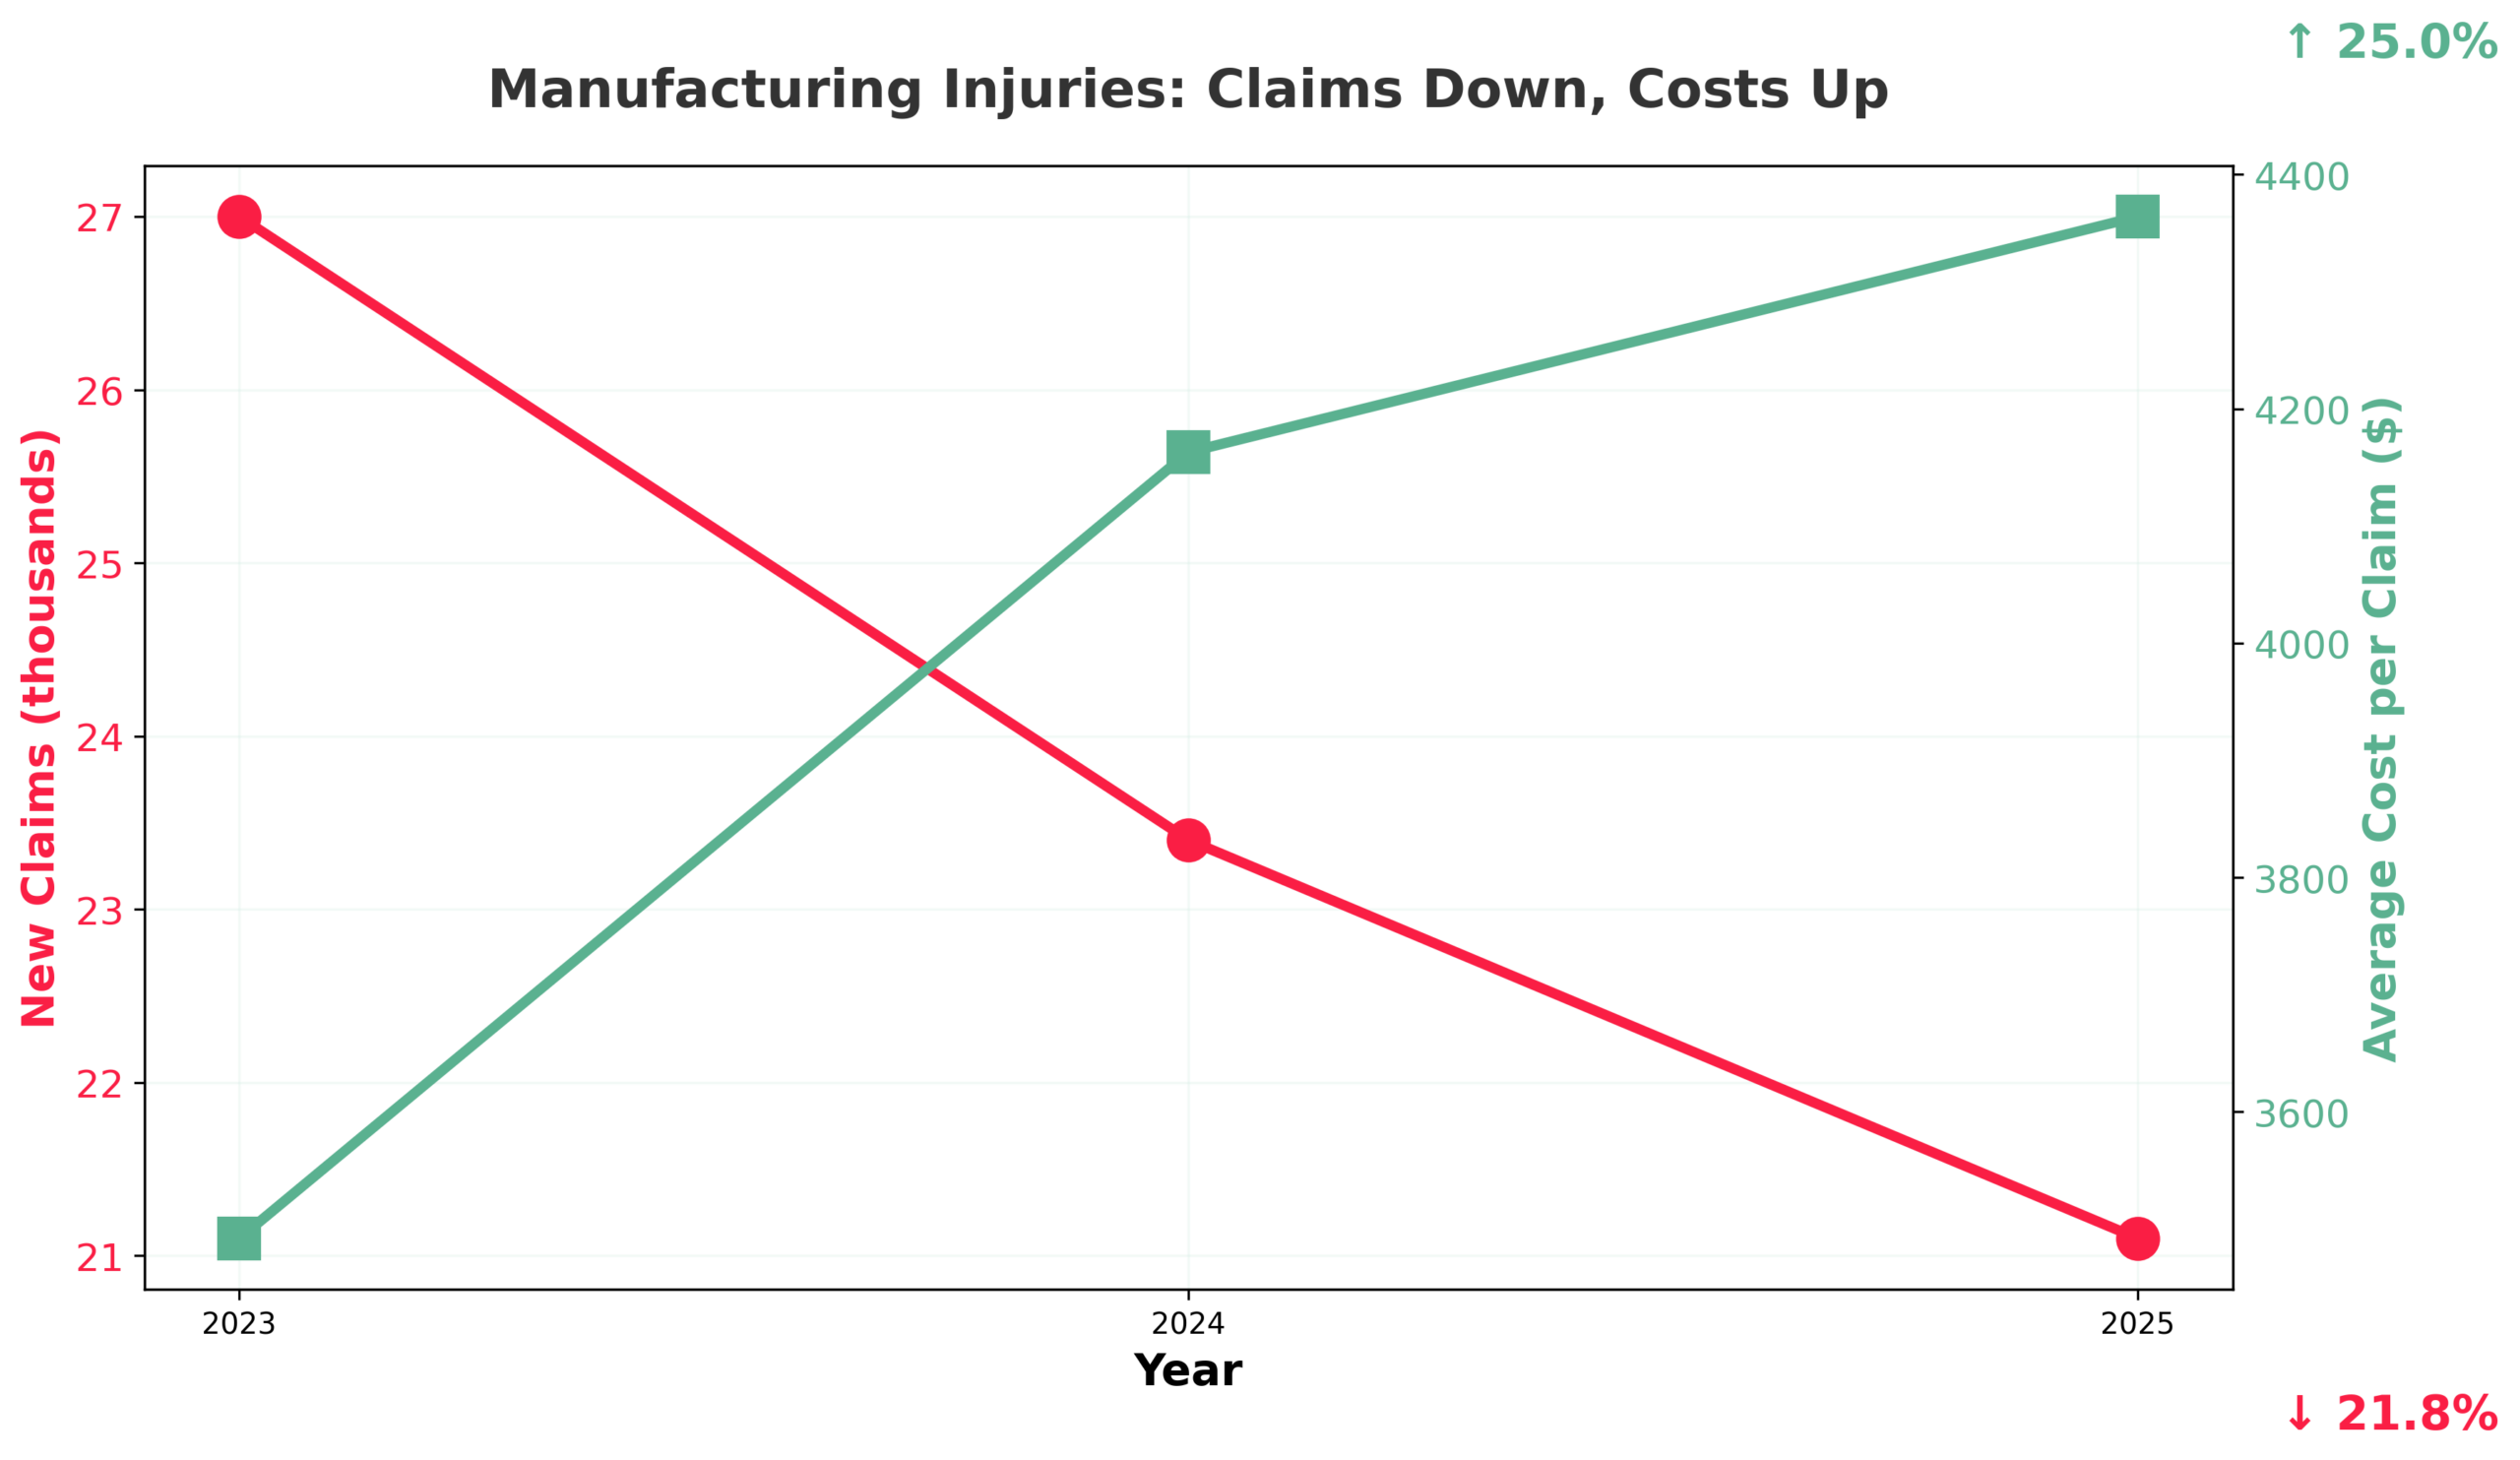
New claims have fallen 21.8% since 2023, yet the average cost per claim has risen 25% over the same period. Weekly compensation claims, a proxy for serious injuries requiring time off work, have barely moved (from 6,354 to 6,245), meaning nearly one in three injuries now involves lost time, up from fewer than one in four just two years ago. Fewer injuries, but the ones that happen are more costly.
In practical terms, this means that while some progress has been made in reducing the number of injuries, the harm that remains is having a greater impact on workers and businesses alike.
Fewer claims, higher costs: what’s driving it?
Across the period from 2023 to 2025, the data shows a consistent pattern. New injury claims are declining, but the cost of managing each claim continues to rise.
Total active claims costs peaked at $167.1 million in 2024 before easing slightly to $163.3 million in 2025 – still 8.2% above 2023 levels. The average cost per active claim has risen every year: from $3,492 (2023) to $4,163 (2024) to $4,364 (2025).
Several factors likely contribute, and the available data does not allow us to isolate which is dominant.
- The composition of the claims pool is shifting. As new (typically less costly) claims decline, the remaining active claims are increasingly dominated by older, more complex injuries still receiving treatment.
- There are health system effects: longer wait times for specialist appointments, surgery, and imaging mean claims stay open longer and accumulate more cost, independent of injury severity.
- Healthcare cost inflation is a factor — physiotherapy rates, surgical costs, and imaging fees have all risen. Finally, ACC’s own process changes, including shifts in assessment and rehabilitation pathways, can affect how costs are allocated and when they are recognised.
The rising proportion of weekly compensation claims is the most telling indicator. These claims, where the injury is serious enough to require time off work and income replacement, have held remarkably steady at approximately 6,200–6,400 per year, while total new claims dropped by 6,000. This means the weekly compensation rate has risen from 23.1% to 29% over three years. The stability of serious injury numbers despite a shrinking workforce suggests that the types of injuries most resistant to reduction are the most severe ones.
The cost burden: who pays most?
Looking more closely at the data shows that the cost of injury is not evenly shared across the workforce. Clear patterns emerge when the data is viewed by age, gender and ethnicity.
Age: The 30–49 squeeze
Workers aged 30–49 account for 43.5% of new claims but 48.2% of active claims costs ($78.6 million) and 52.1% of all weekly compensation costs ($58.6 million). Their claims are not just more numerous, they are more expensive per claim, likely reflecting a combination of physically demanding roles, higher pre-injury earnings (which increase weekly compensation payments), and injuries sustained during peak productive years that require full rehabilitation to enable return to work. This group’s new claims have also declined more slowly (−7.4% in 2024–25) than younger workers (−13.1%), suggesting more persistent exposure to risk.
Gender: Men still being injured more than women
Males account for 80.5% of new claims in 2025, up from 79.0% in 2023, and 82.4% of active claims costs ($134.5 million). Since males hold approximately 67% of manufacturing jobs (Stats NZ, 2025b), their share of injuries substantially exceeds their workforce share. Female claims have declined faster (−17.5%) than male claims (−8.4%), which may reflect differential workforce attrition during the contraction —if female-dominated roles were disproportionately affected by redundancies, fewer female workers would mean fewer female claims, independent of safety improvements.
Ethnicity: Māori disparity
Māori workers account for 13.6% of new manufacturing injury claims in 2025, broadly consistent with their estimated workforce share. Yet they carry 18.6% of active claims costs ($30.3 million) and 19.7% of weekly compensation costs ($22.1 million). Their average weekly compensation cost per claim at $20,010 is the highest of any ethnic group, exceeding the European average of $19,498 and well above the Asian average of $14,290 (ShopCare, 2025a; 2025b).
This disparity is consistent with broader occupational health research. Lilley et al. (2019) found that Māori workers are 1.6 times more likely to be killed at work, with work-traffic fatality rates nearly three times higher. The ACC data cannot explain why Māori workers’ injuries appear to cost more on average.
Possible contributing factors include concentration in higher-risk occupations and sub-sectors, less access to early intervention and rehabilitation, socioeconomic factors that extend recovery time, or systemic differences in workplace safety culture.
The health system access question is particularly relevant – if Māori workers face longer delays in accessing treatment or rehabilitation, either due to geographic barriers (many manufacturing roles in regional areas with limited specialist services) or systemic inequities in healthcare access, their claims would naturally run longer and cost more, independent of the injury itself. The cumulative decline in Māori new claims (−30.8% since 2023) is the steepest of any ethnic group, which could reflect workforce contraction, improved safety, or reduced access to employment — each with very different implications.
The sector contraction effect
A key question sits behind the decline in new claims. Is the manufacturing sector becoming safer, or are there simply fewer workers at risk of injury?
International research provides useful framing here. Workplace injury rates are consistently found to be procyclical —meaning they follow the economic cycle, rising during economic booms and falling during recessions. Studies from the USA, UK, Italy, Spain, and Australia have all confirmed this pattern, with manufacturing and construction showing the strongest cyclical sensitivity (Asfaw et al., 2011; Davies et al., 2009; Farina et al., 2018).
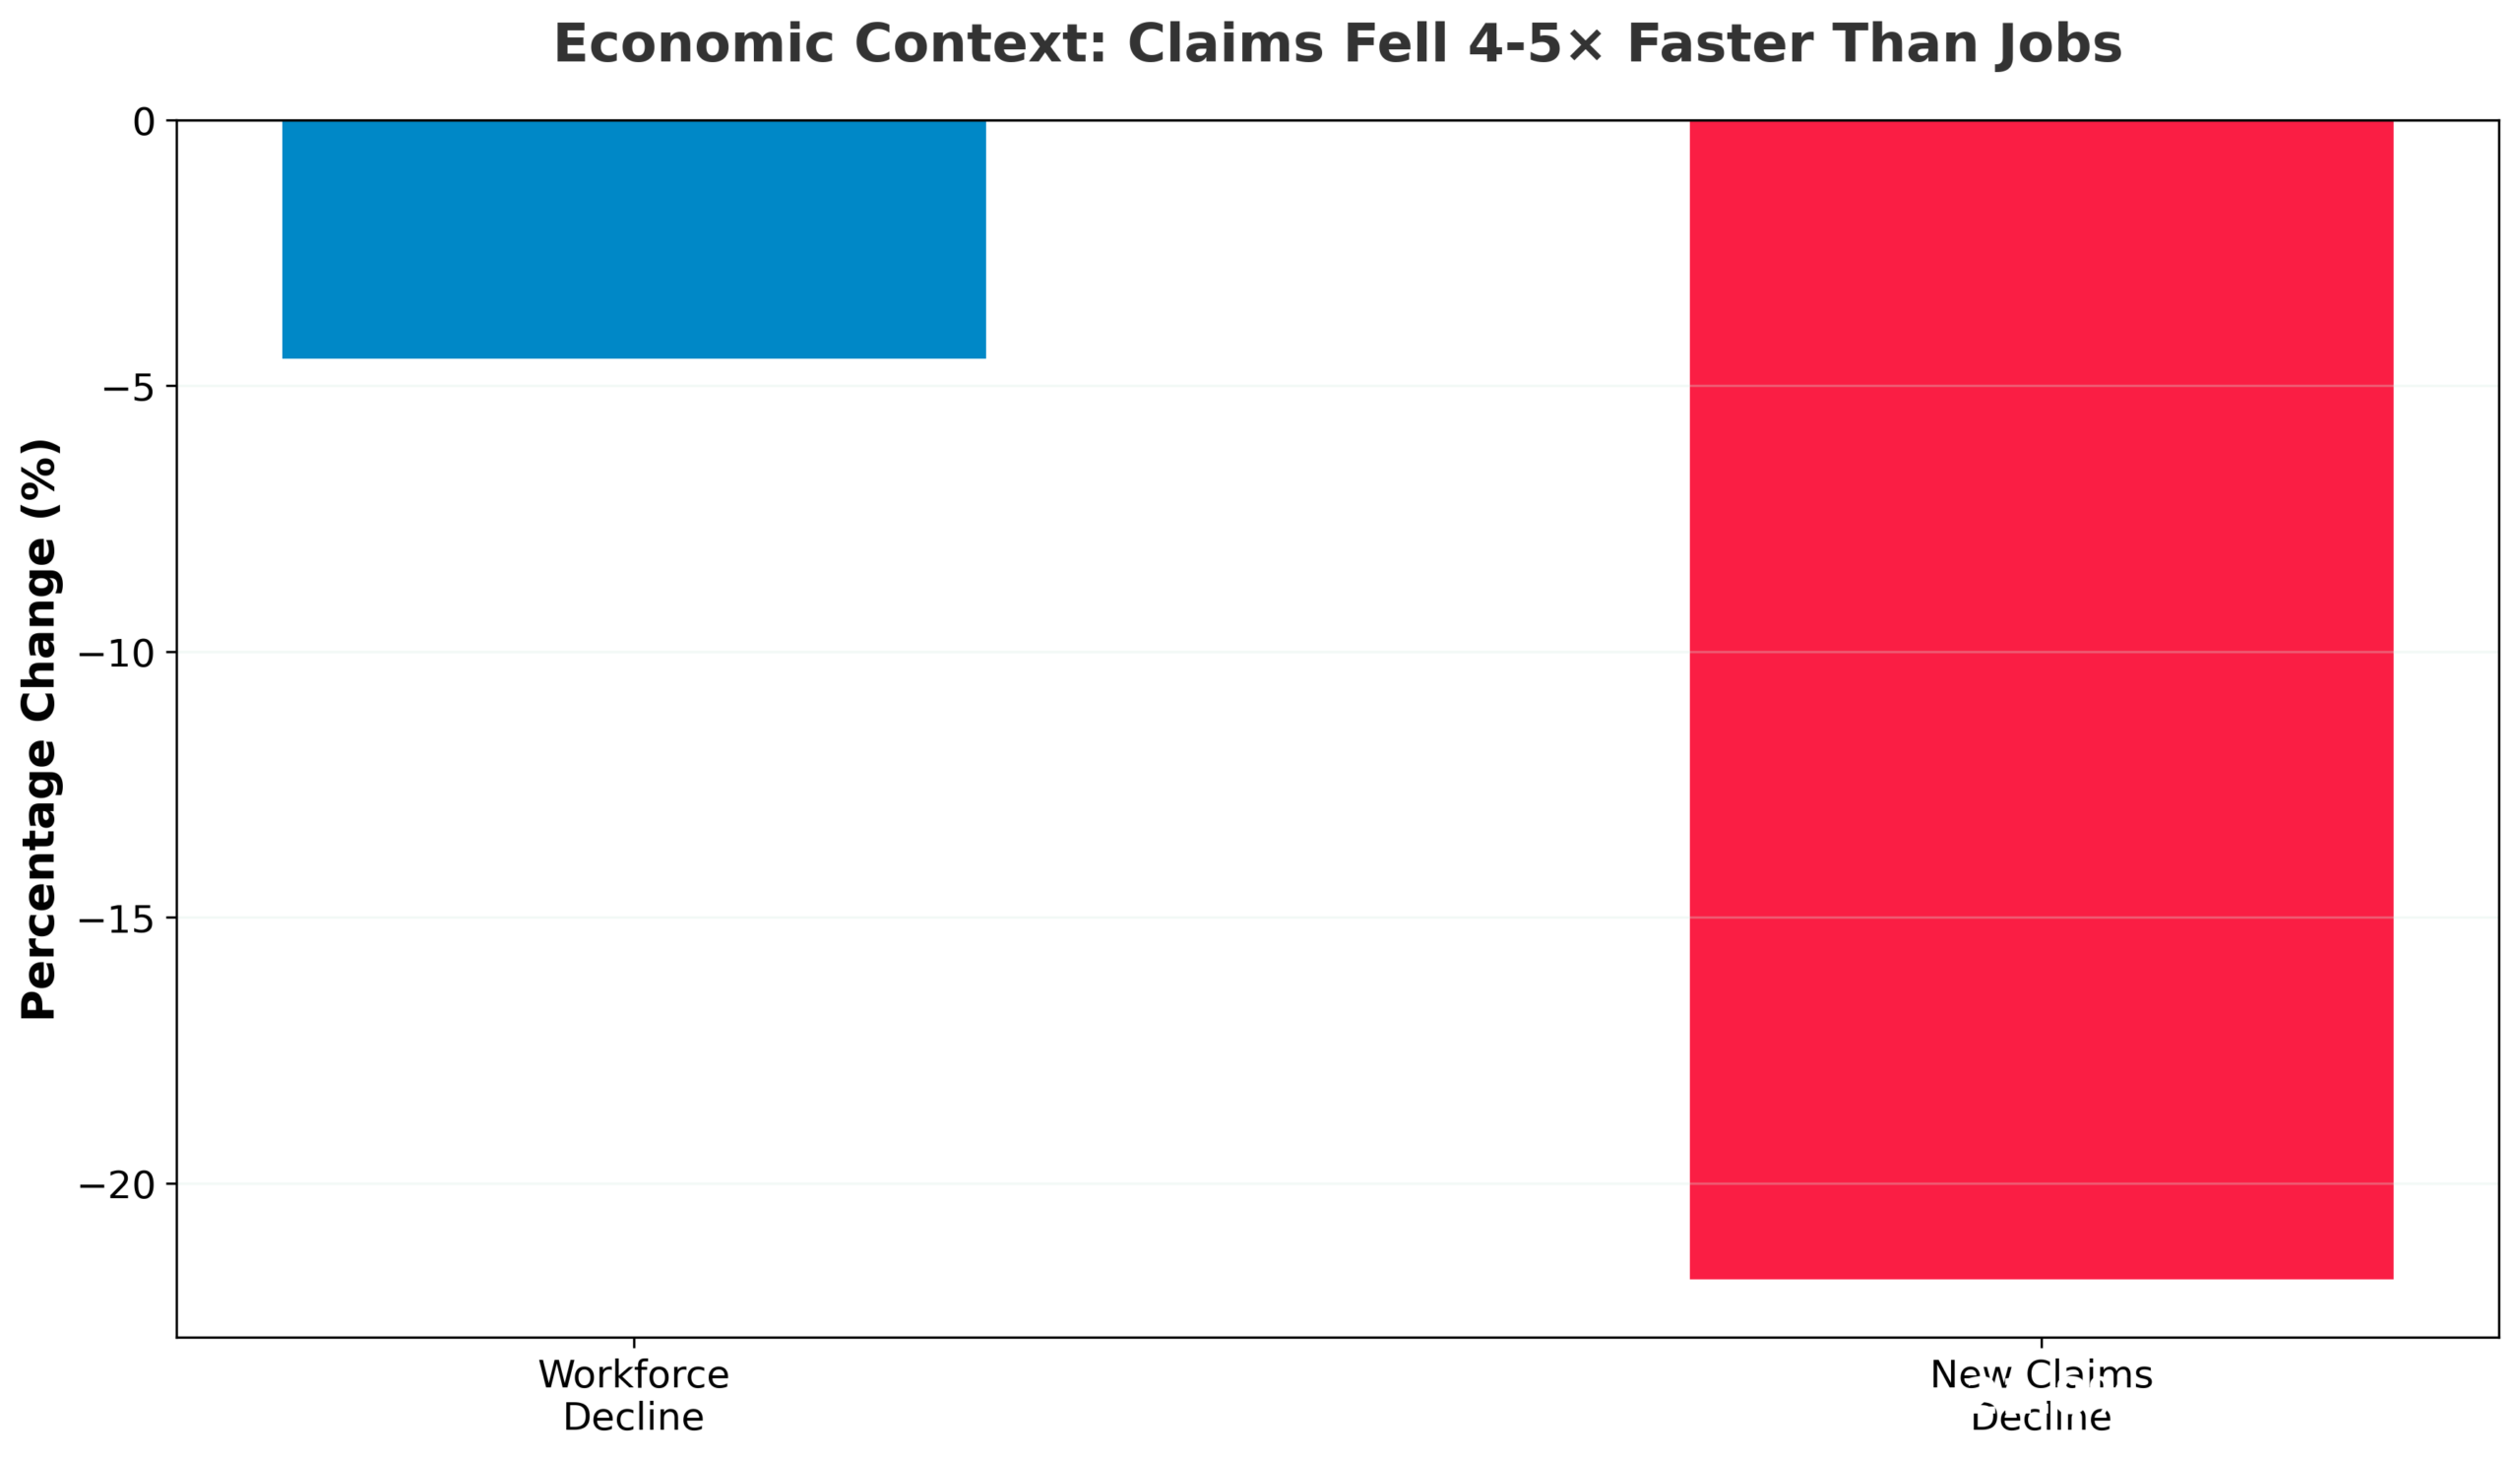
New Zealand’s manufacturing sector has experienced sustained contraction through 2023–2025. Total filled jobs declined from approximately 234,500 in early 2023 to 225,000 by mid-2024 (Stats NZ, 2025b). Business deaths exceeded births for the first time in the year to February 2025 (Stats NZ, 2025c). New claims fell 21.8% over the same period. If the workforce declined by roughly 4–5%, then claims have fallen by four to five times the rate of employment decline —suggesting real improvement beyond just fewer workers. UK research estimated that approximately 10% of the fall in injury rates during the latest recession was attributable to the economy, rising to 20% in construction (HSE, 2013). If a similar proportion applies to NZ manufacturing, the economic effect alone would account for only a fraction of the 21.8% claims decline.
However, the procyclical literature identifies a critical nuance: minor injuries are procyclical, but major injuries are not (Davies et al., 2009). This maps precisely onto the NZ data. Total new claims (which include many minor incidents) have fallen sharply, while weekly compensation claims (serious injuries requiring time off) have barely moved. Some of the total claims decline may also reflect changed reporting behaviour —international research shows that workers facing job insecurity in a contracting economy are less likely to report minor injuries, fearing the consequences (Boone & Van Ours, 2006).
Sub-sector divergence
Looking at manufacturing as a single sector masks significant differences between sub-sectors. The data shows wide variation in both injury rates and costs.
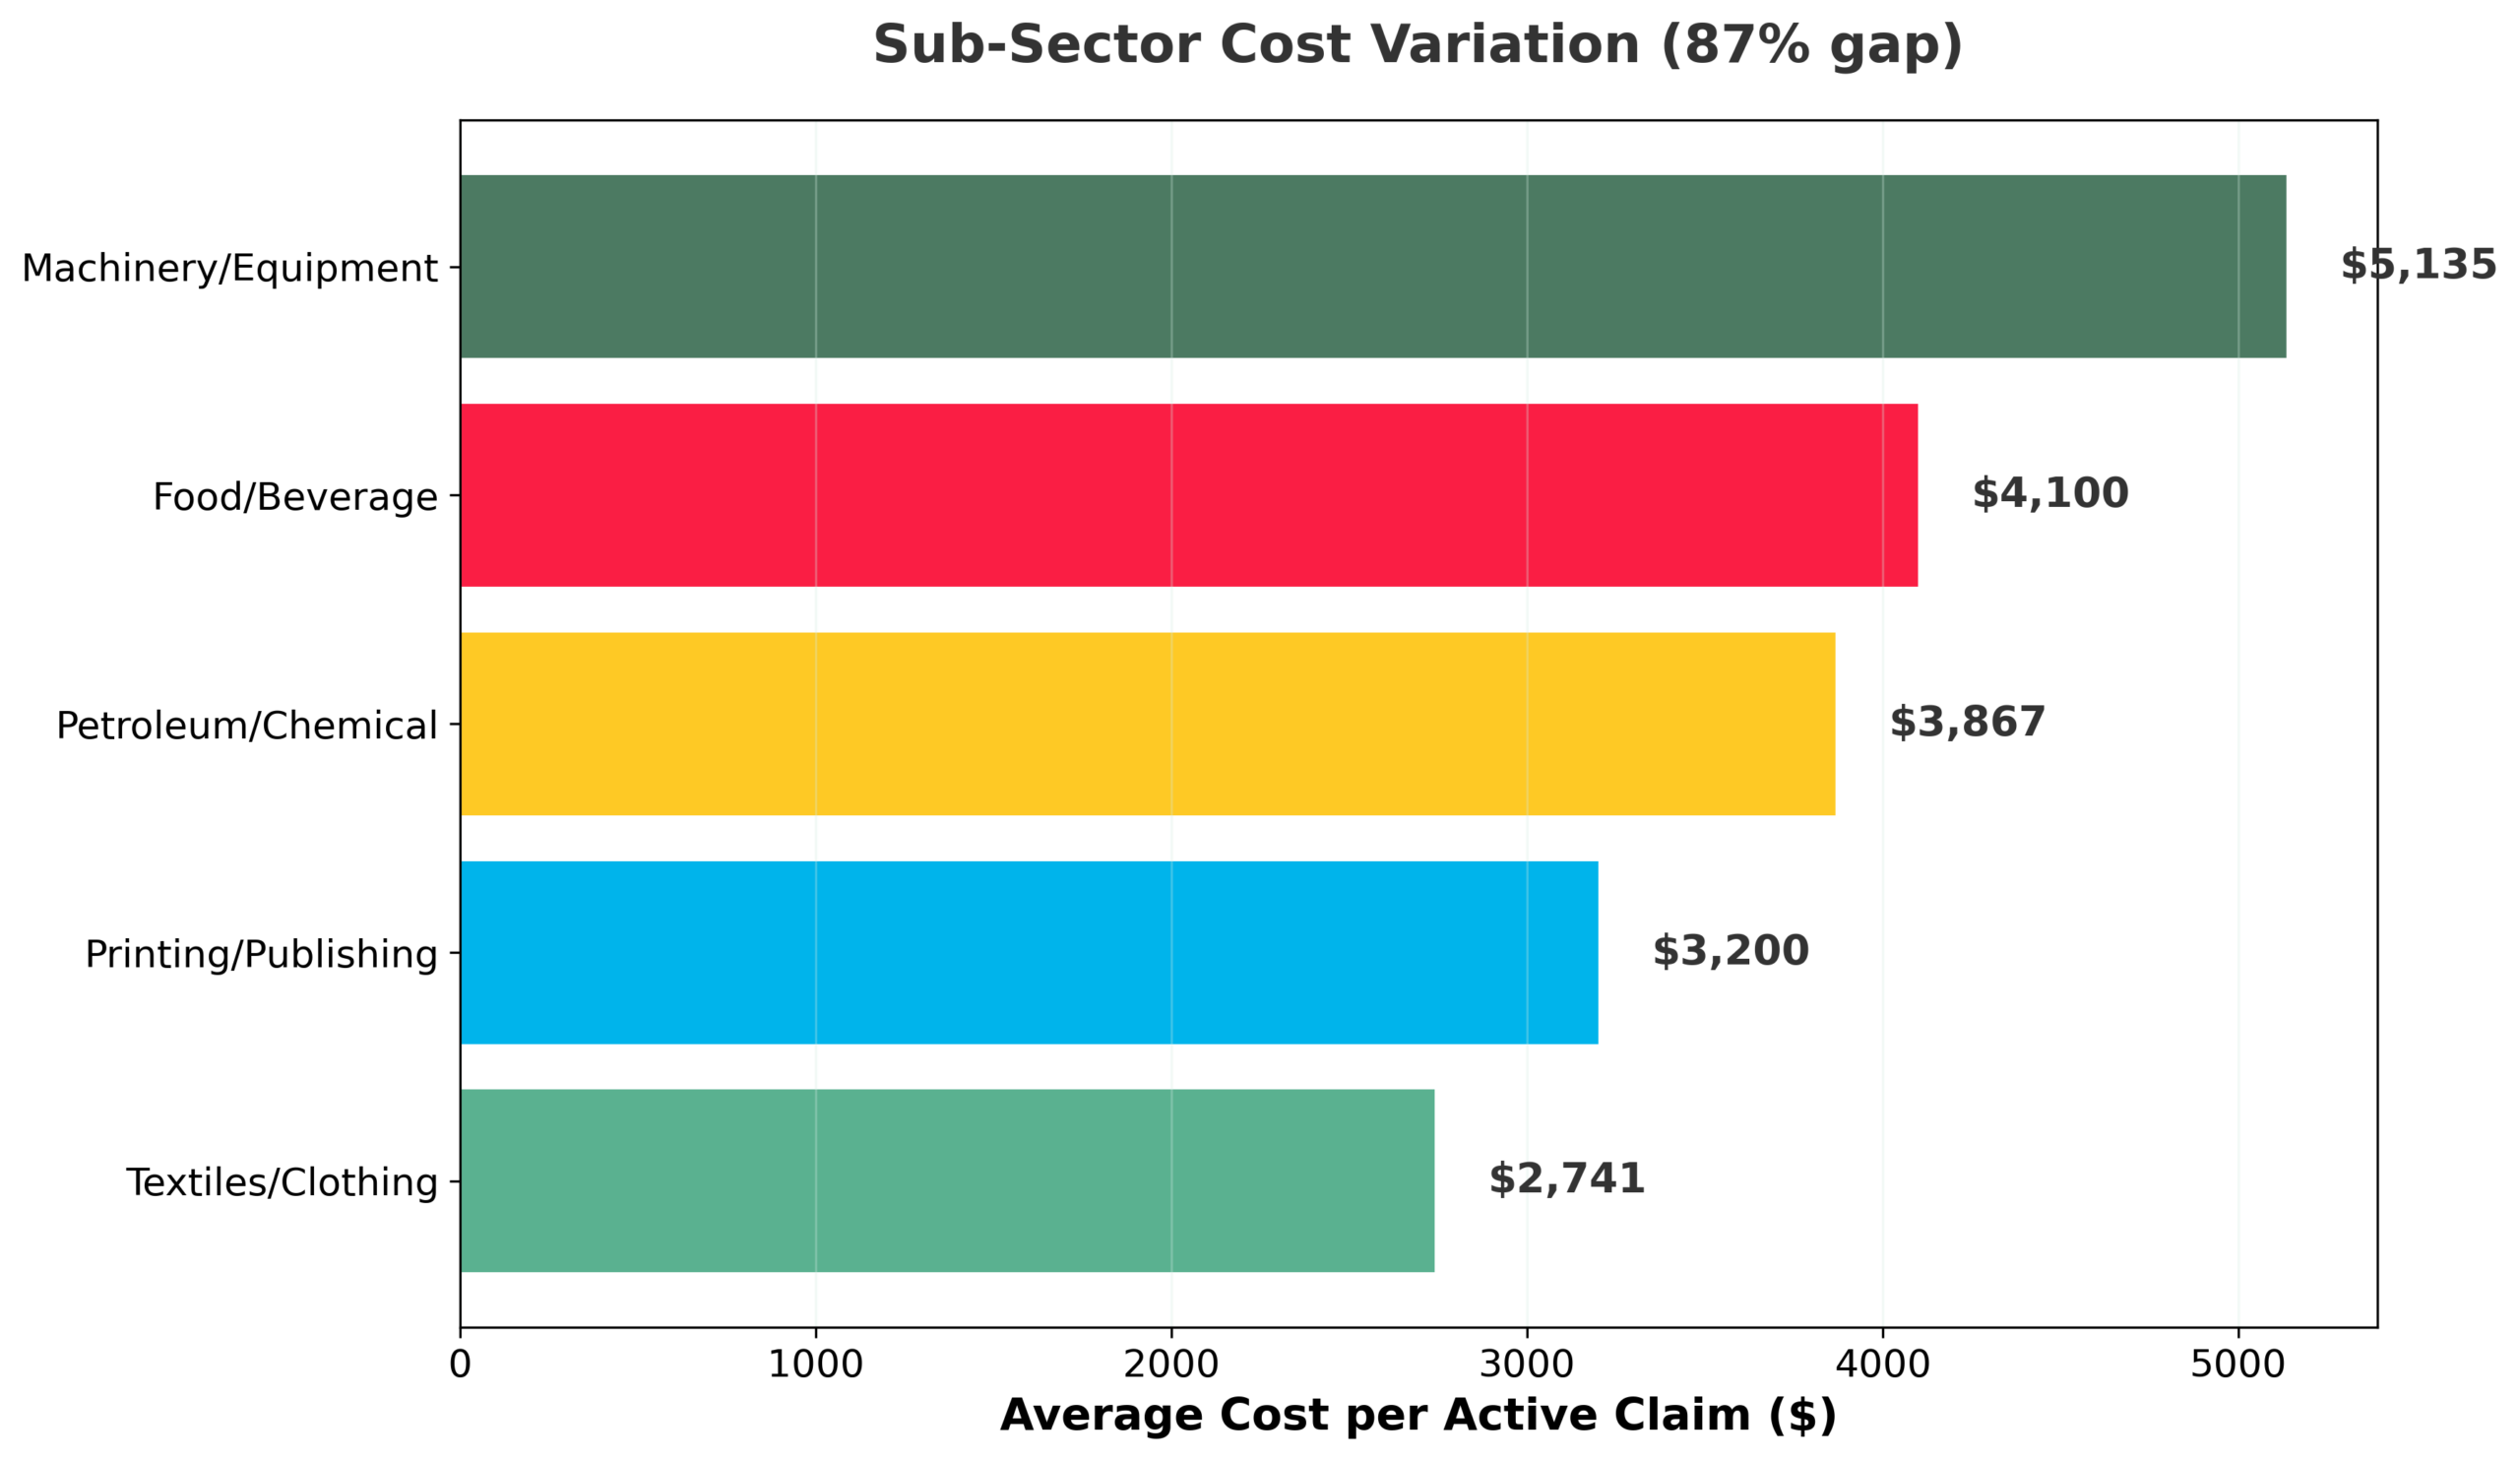
In 2025, the average cost per active claim ranged from $2,741 in Textile, Clothing, Footwear & Leather to $5,135 in Machinery & Equipment —an 87.3% gap.
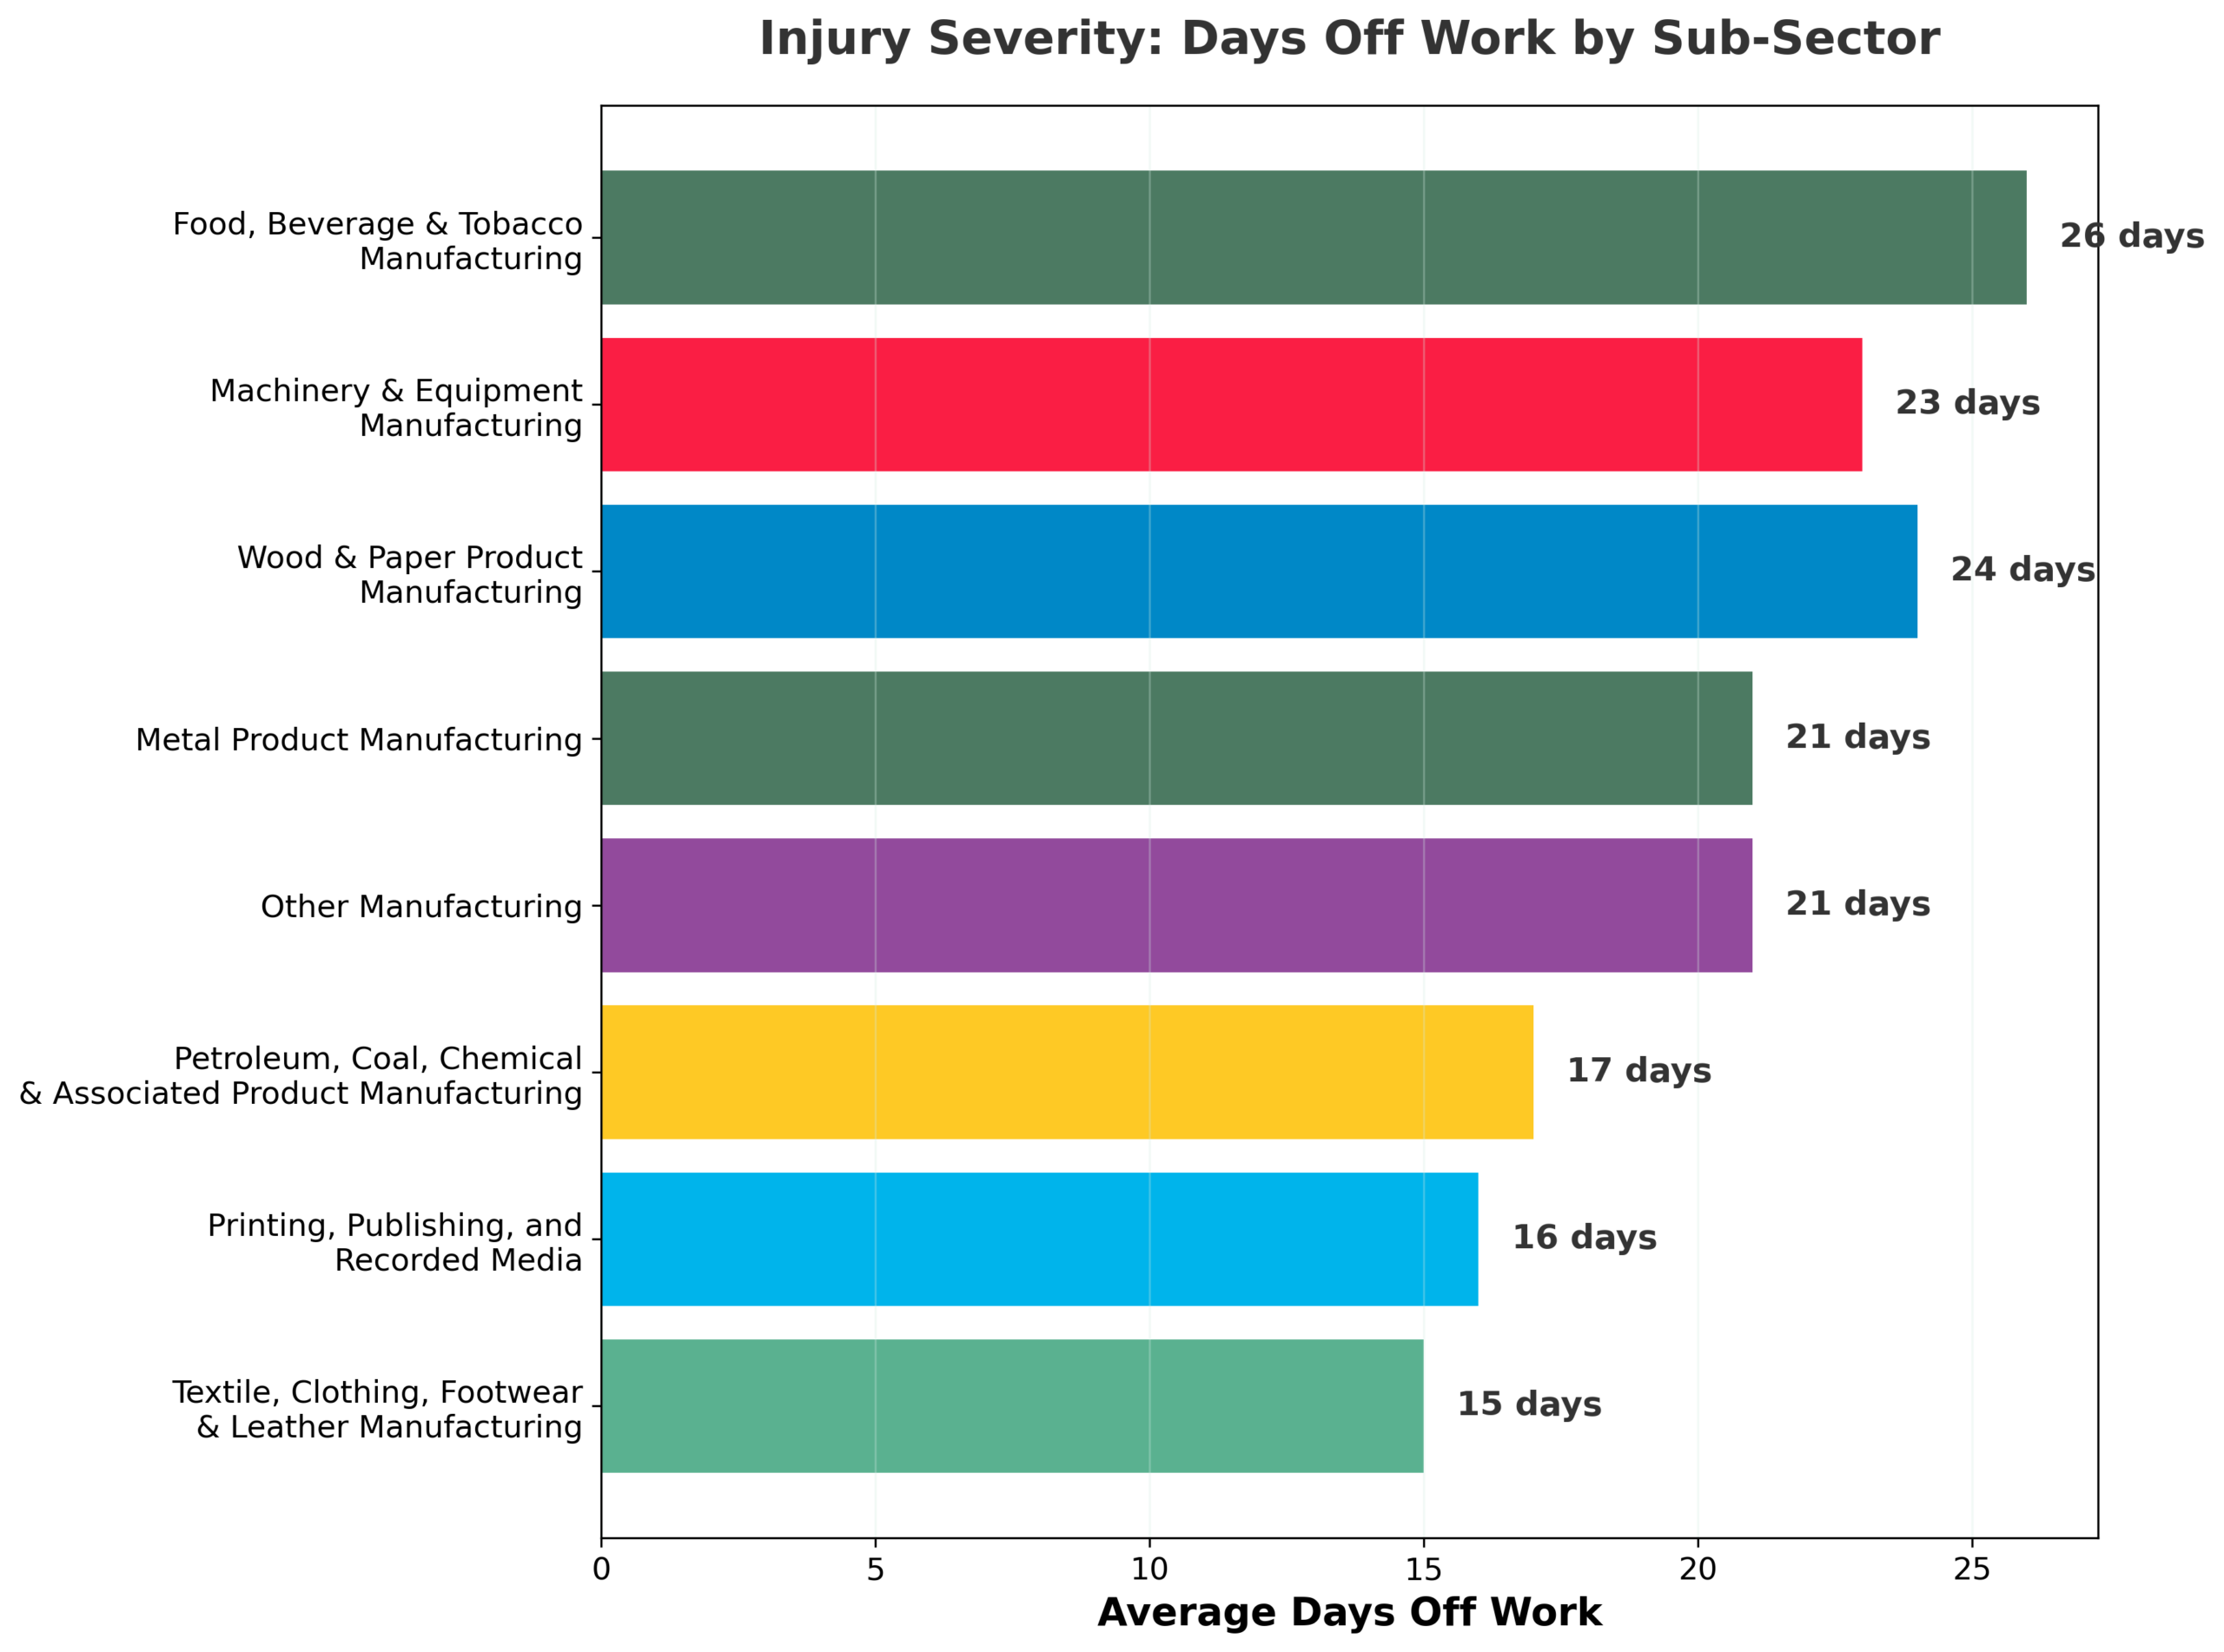
Food, Beverage & Tobacco generated the most total days off (233,136) and the longest average absence (29 days), while Printing, Publishing and Recorded Media had the shortest (17 days) (ShopCare, 2025b).
The most notable shift occurred in Petroleum, Coal, Chemical & Associated Product Manufacturing, where active claims fell 20.9% from 2024 to 2025 but the average cost per claim surged 39.9% (from $2,765 in 2024 to $3,867 in 2025).
This is the starkest example of the pattern seen across the sector —fewer injuries but higher costs per injury —though the caveats about health system and ACC process factors apply equally here. It may also reflect the specific nature of chemical and process-related injuries, which can involve burns, respiratory exposure, or toxic contact that require specialised treatment not subject to the same wait times as musculoskeletal referrals.
These patterns suggest that sector-wide safety initiatives may be less effective than targeted, sub-sector-specific interventions addressing the particular hazards of each environment.
When the economy recovers: the injury risk ahead
If part of the current decline in claims is linked to economic contraction, injury rates are likely to rise again as conditions improve. International evidence consistently points to several predictable risk factors during economic recovery. Understanding the specific mechanisms is essential for preparing an effective response.
New and inexperienced workers
When demand picks up, employers hire. New workers lack site-specific knowledge — they do not know which machine has the sticky guard, which floor gets slippery near the wash bay, or how to safely lift awkward-shaped components.
The international research identifies the rapid incorporation of inexperienced workers as one of the strongest drivers of injury rate increases during economic upswings (De la Fuente et al., 2014; Fabiano et al., 2008). In New Zealand’s context, this is compounded by the manufacturing sector’s reliance on migrant workers, who may face language barriers, unfamiliarity with local safety regulations, and reluctance to raise concerns with employers.
Overtime and fatigue
Before new hires are onboarded, existing staff absorb increased demand through longer hours. Overtime means fatigue, and fatigue degrades decision-making, reaction time, and physical coordination. A worker in their tenth hour of repetitive lifting is physiologically more vulnerable than in their second hour. The research consistently links hours worked to injury rates (Dembe et al., 2005; Folkard & Lombardi, 2006), though the relationship is not perfectly linear — some voluntary overtime is performed by experienced workers who may manage risk effectively.
Work intensity and pace pressure
Even without overtime, the pace of existing shifts increases during upswings. Faster production lines, tighter deadlines, less downtime between tasks. Workers adapt rationally — they carry two loads instead of one, they do not wait for the forklift, they skip resetting the guard. This is not recklessness; it is the predictable response of workers trying to meet production targets. The safety margins that exist when production runs at 70% capacity evaporate when it runs at 95%. Boone et al. (2011) noted that logically, during economic growth there is more work being done, which increases the likelihood of injuries.
Deferred maintenance and ageing capital
During downturns, businesses defer equipment maintenance and replacement. When production ramps back up, workers operate older, less well-maintained machinery. Guards may be worn, emergency stops may be slower, ventilation systems may be less effective. Asfaw et al. (2011) identified physical capital depreciation as a significant contributor to injury rate increases during economic recoveries, particularly in manufacturing and mining. New Zealand’s manufacturing sector, with business deaths exceeding births since 2024, is likely accumulating a maintenance deficit that will manifest when utilisation rates increase.
Temporary and contract labour
Demand upswings are typically met first with temporary and contract workers before permanent positions are created. These workers receive less site-specific training, have less familiarity with workplace hazards, may be managed by a labour hire company rather than the business controlling the worksite, and may feel less empowered to refuse unsafe work. The Spanish research found that employment stability had a measurable protective effect on injury outcomes, and that economic recovery concentrated injuries among temporary and less-tenured workers (De la Fuente et al., 2014).
Normalisation of reporting
Some portion of the current claims decline may reflect underreporting by workers anxious about job security in a contracting sector. When the economy recovers and employment prospects improve, workers are more likely to report injuries they might previously have absorbed. Boone and Van Ours (2006) tested this by comparing fatal accidents (always reported regardless of economic conditions) with non-fatal ones, and found that only non-fatal rates were cyclically sensitive — consistent with reporting behaviour playing a role. The implication is that some of the apparent increase in injuries during recovery may not represent new harm, but rather the re-emergence of reporting that was suppressed during the downturn.
The key takeaway is that a rise in injuries during economic recovery is a well-documented pattern, rather than a failure of safety efforts. The organisations best positioned to manage this transition will be those that invest in safety systems, induction processes, and worker engagement now, before the recovery-driven hiring begins. Waiting until injury rates start climbing again means responding to harm that was preventable.
The evidence on what works
One finding from the research stands out clearly. Workers who do not feel encouraged to speak up about safety concerns experience significantly higher rates of serious harm. Khieu (2021), surveying workers across four high-risk industries including manufacturing, found that workers who disagreed that their employer encouraged them to speak up about safety concerns experienced 2.4 times more serious harm incidents. Workers not told how their views were considered in health and safety decisions faced 1.7 times more serious harm. These are not modest effect sizes —they suggest that genuine worker engagement is among the most powerful levers available.
Questions your business should be asking:
- When the economy recovers and we start hiring again, do we have induction and training systems ready to bring new workers up to speed safely?
- Are we tracking which injuries are costing us the most —and investing proportionately in preventing them?
- With nearly half of all injury costs concentrated in musculoskeletal sites (back, shoulder, knee, ankle), are our manual handling and ergonomic practices genuinely effective, or just compliant on paper?
- Do our workers feel safe enough to speak up about hazards and near-misses —and do we act on what they tell us?
- Are we maintaining our equipment and plant to the standard required, or has deferred maintenance during the downturn created hidden risks?
- If our workforce includes Māori workers, temporary staff, or younger workers, are we addressing the specific barriers these groups face in staying safe?
- And are we looking at our own sub-sector’s injury patterns, rather than relying on sector-wide averages that may not reflect our particular hazards?
Advice and tools for bringing down injuries
ShopCare provides free, practical resources designed for the retail sector and its supply chain, including manufacturing. These resources focus on supporting businesses to take action and improve outcomes for workers.
They include community membership, training programmes, practical guidance documents and real-world case studies. See manufacturing-specific links below – all resources are available at shopcare.org.nz.
Working together, we can support safer, healthier manufacturing workplaces across Aotearoa.
Free resources:
Training
- Cultural Competency Training — A three-part eLearning series building cultural awareness and Māori values in workplace safety, from introductory te reo through to leadership application.
- HSR Learning Pathway — A 10-module interactive programme developed with HSE Global for Health & Safety Representatives and safety champions. A free induction module is available to trial before enrolling.
- 4Ds® Digital Learning Tools — Developed with Learning Teams Inc., these modules teach teams to identify what is Dumb, Dangerous, Difficult, or Different in everyday work before it leads to harm. Includes downloadable guides for leaders and HSRs.
Guidance documents
- Early Notification and Intervention of Discomfort or Pain — Good practice guidelines for catching musculoskeletal issues early, with companion staff poster, treatment flowchart, reporting form, and employer checklist.
- Line Marking Guidance — Practical guidance on workplace line marking for traffic management and pedestrian safety.
- Driver Guidance — Separate guides for employers and employees covering vehicle safety and on-road risk management.
Case studies
- Harvey Norman — Participative Ergonomics — How co-designed ergonomic interventions led to a 40% drop in ACC claim costs and zero ergonomics-related incidents.
- Industry Med — Return-to-Work in Manufacturing — A coordinated onsite healthcare model improving recovery and return-to-work outcomes in a rural manufacturing setting.
- Toll Global Express — Workplace Safety — Video case study showcasing safety leadership, culture, site design, and worker engagement in practice.
- Foodstuffs South Island — Palletised Product Stability — Collaborative problem-solving that reduced near-misses and product damage by 30%.
- The Warehouse Group — Critical Risk Identification — How traffic management plans and exclusion zones achieved a 50% reduction in incidents.
- Foodstuffs North Island — Injury Management Refresh — The ‘Back In Action’ programme that streamlined injury reporting and provider communication.
- Comvita — Vehicle Safety — Achieving a considerable reduction in vehicle-related incidents through a targeted safety programme.
References
Asfaw, A., Pana-Cryan, R., & Rosa, R. (2011). The business cycle and the incidence of workplace injuries. Journal of Safety Research, 42(1), 1–8.
Boone, J., & Van Ours, J. C. (2006). Are recessions good for workplace safety? Journal of Health Economics, 25(6), 1069–1093.
Burridge, J. D., Marshall, S., & Laing, R. (1977). Work-related hand and lower-arm injuries in New Zealand, 1979 to 1988. Australian and New Zealand Journal of Public Health.
Davies, R., Jones, P., & Nunez, I. (2009). The impact of the business cycle on occupational injuries in the UK. Social Science & Medicine, 69(2), 178–182.
De la Fuente, V. S., López, M. A. C., González, I. F., Alcántara, O. J. G., & Ritzel, D. O. (2014). The impact of the economic crisis on occupational injuries. Journal of Safety Research, 48, 77–85.
Dembe, A. E., Erickson, J. B., Delbos, R. G., & Banks, S. M. (2005). The impact of overtime and long work hours on occupational injuries and illnesses. Occupational and Environmental Medicine, 62(9), 588–597.
Elicit. (2024). Manufacturing health and safety in New Zealand: Literature review report. Elicit Research.
Fabiano, B., Curro, F., Reverberi, A. P., & Pastorino, R. (2008). A statistical study on temporary work and occupational accidents. Safety Science, 46(3), 535–544.
Farina, E., Giraudo, M., Costa, G., & Bena, A. (2018) titled “Injury rates and economic cycles in the Italian manufacturing sector” in Occupational Medicine, 68, 459–463. Folkard, S., & Lombardi, D. A. (2006). Modeling the impact of the components of long work hours on injuries and accidents. American Journal of Industrial Medicine, 49(11), 953–963.
HSE (Health and Safety Executive). (2013). The impact of recession on the incidence of workplace injuries. Research Report RR943. London: HSE.
Khieu, T. (2021). 6F.001 Injury at work: How can workers contribute to reduce harms? Occupational and Environmental Medicine, 78(Suppl 1).
Kool, B., Ameratunga, S., Scott, N., Lawrenson, R., & Christey, G. (2017). The epidemiology of work-related injury admissions to hospitals in the Midland region of New Zealand. Injury, 48(10), 2131–2138.
Lilley, R., Jaye, C., & Davie, G. (2016). 193 Injury among older workers in an ageing New Zealand workforce. Injury Prevention, 22(Suppl 2), A70.
Lilley, R., McNoe, B., Davie, G., Horsburgh, S., Maclennan, B., & Driscoll, T. (2019). Identifying opportunities to prevent work-related fatal injury in New Zealand. Injury Epidemiology, 6(1), 1–10.
Lilley, R., Maclennan, B., McNoe, B., Davie, G., Horsburgh, S., & Driscoll, T. (2020). Decade of fatal injuries in workers in New Zealand. Injury Prevention, 27(2), 124–131.
Lilley, R., Davie, G., McNoe, B., Horsburgh, S., Driscoll, T., & Cryer, C. (2022). Impact of legislative reform on worker fatalities in New Zealand workplaces. Occupational and Environmental Medicine, 79(9), 614–620.
Data sources
ShopCare. (2023a). 2023 Manufacturing new claim workplace injury interactive data dashboard. ShopCare Charitable Trust.
ShopCare. (2023b). 2023 Manufacturing active claim data. ShopCare Charitable Trust.
ShopCare. (2024a). 2024 Manufacturing new claims. ShopCare Charitable Trust.
ShopCare. (2024b). 2024 Manufacturing active claims. ShopCare Charitable Trust.
ShopCare. (2025a). 2025 Manufacturing new claims. ShopCare Charitable Trust.
ShopCare. (2025b). 2025 Manufacturing active claims. ShopCare Charitable Trust.
Stats NZ. (2025a). Business enterprises and geographic units by employee count and industry, February 2025. Stats NZ Tatauranga Aotearoa.
Stats NZ. (2025b). Quarterly employment survey: Filled jobs by industry and sex, 1989–2025. Stats NZ Tatauranga Aotearoa.
Stats NZ. (2025c). Business births and deaths by territorial authority, 2001–2025. Stats NZ Tatauranga Aotearoa.
Disclaimer: This document is intended to provide general information and guidance and is not intended to address specific circumstances of any individual or entity in New Zealand. It is based on research and practices as understood at the time of publication and may include AI-assisted information. Advice or guidance provided by ShopCare does not constitute legal advice. Legal advice should be sought to ensure compliance with the Health and Safety at Work Act, and any other applicable statutes or regulations. ShopCare does not accept any responsibility or liability, whether in contract, equity, or tort, including negligence, or under any other legal principle, for any direct or indirect losses or damage. You are free to copy, distribute and adapt this material, as long as you attribute it to ShopCare Charitable Trust.